- 在線時間
- 115 小時
- 最後登錄
- 25-10-30
- 國民生產力
- 2688
- 附加生產力
- 43290
- 貢獻生產力
- 0
- 註冊時間
- 17-11-24
- 閱讀權限
- 10
- 帖子
- 27981
- 主題
- 0
- 精華
- 0
- 積分
- 73959
- UID
- 2734087

|
勇闖UK2023 發表於 24-6-21 18:57 
大家小朋友考完Year12校內試未呀?
今個暑假又要溫書、搵學科體驗、預備PS、填UCAS和睇大學,真係忙到七彩 ...
Guide to AS and A level results for England, summer 2024
https://www.gov.uk/government/news/guide-to-as-and-a-level-results-for-england-summer-2024
Grading has continued as normal in summer 2024, following the return to pre-pandemic standards last year. Overall A level results are similar to summer 2023.
From:
Ofqual
Published
15 August 2024
More than 800,000 A level results are being issued to students in England today. Students’ grades have been determined by their performance in their exams and assessments.
Grading has continued as normal this summer, following the return to pre-pandemic standards last year. It is important that grades reflect what students know, understand and can do, to support students in making the right choices about their next steps.
Sir Ian Bauckham, Chief Regulator, said:
Congratulations to all students receiving their results today. This is the culmination of a lot of hard work for them and everyone who supported them on the way.
A levels are highly trusted qualifications. Students can be confident their results will be valued and understood by employers and universities for years to come.
Key points
Grading has continued as normal this summer and standards have been maintained from summer 2023.
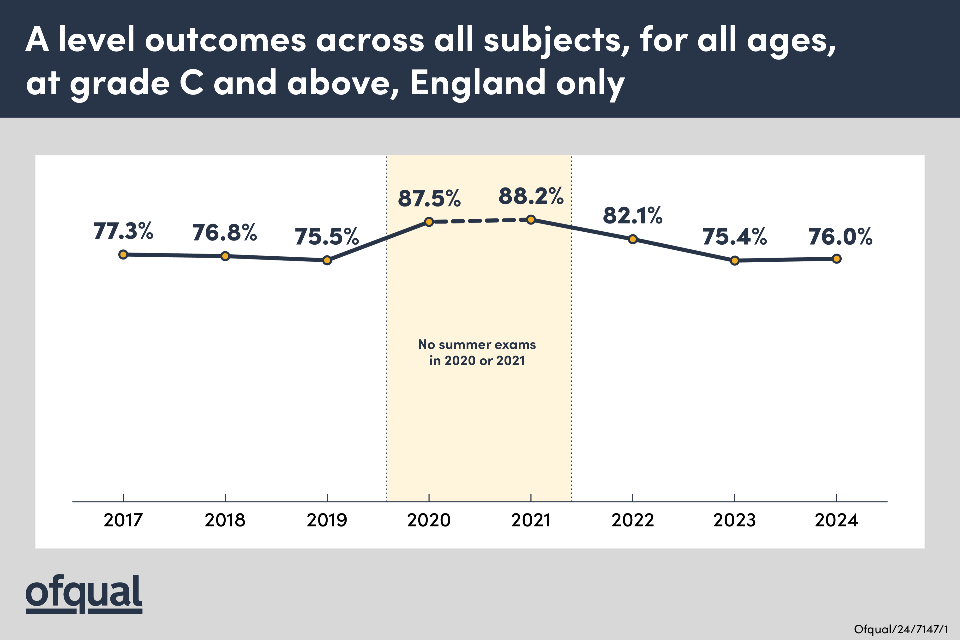
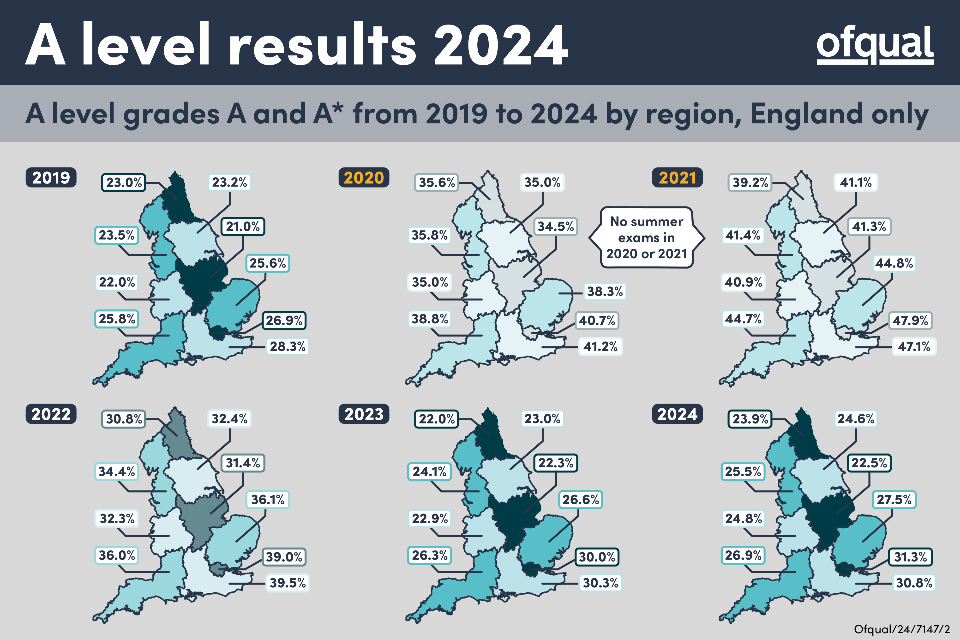
Overall A level results in England are similar to 2023. Outcomes at grade A and above are 27.6% compared with 26.5% in 2023, and outcomes at grade C and above are 76.0% compared with 75.4% in 2023. Every year there are small fluctuations in results. This can be due to changes in the cohort of students and changes in course choices over time.
Overall AS results in England are similar to 2023. Outcomes at grade A are 23.0% compared with 21.8% in 2023. Entries for AS have fluctuated in recent years, making it much more difficult to interpret any changes.
Today (15 August 2024) we are publishing:
a summary of results (below)
infographics about this year’s A level results
https://www.gov.uk/government/publications/infographic-a-level-results-2024
interactive visualisations of outcomes by centre type, variability in school and college A level results, A level outcomes in England, A level grade combinations, and an interactive map of England showing A level results in different subjects by grade and county
https://analytics.ofqual.gov.uk/
As normal, the Joint Council for Qualifications (JCQ) has published results in England for AS and A level, overall and by subject. These results are also shown in our interactive visualisation.
https://analytics.ofqual.gov.uk/apps/Alevel/Outcomes/
Centre type results
Ofqual has updated its interactive visualisation to show A level results for different types of school and college compared with previous years, overall and by subject. The centre type categories are based on the national centre number (NCN) register and are self-reported by schools and colleges. Our interactive visualisations only include those schools or colleges that have entries for a particular subject in every year from 2018 to 2024.
Overall results for all types of schools and colleges are, in general, broadly similar to 2023 at grade A and above. When students take exams, the same assessment arrangements apply to everyone. Any differences in outcomes are therefore likely to reflect longstanding trends in the pattern of results for different centre types, and any changes compared to 2023 will reflect changes in attainment.
Cumulative percentage outcomes by centre type – grade A and above
Percentage of candidates awarded grade A and above in all subjects combined by centre type, 2019, 2023 and 2024
Centre type 2019 2023 2024
Academies 24.0 25.4 26.5
Free schools 33.4 33.8 37.1
FE establishment 16.2 14.0 14.8
Independent 44.9 47.4 49.4
Other 22.8 23.4 22.5
Secondary comprehensive 20.1 22.0 22.3
Secondary modern 15.3 15.7 17.2
Secondary selective 37.0 39.3 41.0
Sixth form college 22.3 22.9 23.8
······
 |
|


 發表於 24-6-21 18:57